MARKET VOLATILITY REMAINS
SUMMARY
After last week, the S&P 500 index is back to where it was in mid-July and about 6.5% above its June lows. Our indicators are currently keeping us neutral as there is no clear evidence that we should be overly bullish or bearish.
BROAD MARKET PERFORMANCE (AS OF 9/16/2022)
| YTD Performance | Trailing 1 Year Performance | |
|---|---|---|
| SPY (SPDR S&P 500 ETF) | -18.22% | -12.55% |
| DIA (SPDR DJIA ETF) | -14.20% | -9.91% |
| QQQ (Nasdaq 100 ETF) | -27.05% | -23.10% |
| TLT (20+ Year US Treasury ETF) | -26.76% | -27.23% |
| AGG (US Agg Bond ETF) | -12.17% | -13.12% |
| Table 1: Source: ETFdb.com. | ||
MACROECONOMIC VIEW
Several signs seem to indicate global consumer prices are peaking. However, inflation remains elevated, which will most likely keep central banks on the offense near term. Our concern is that the Fed is fighting yesterday’s inflation battle. This is illustrated by the NDR Inflation Timing Model having declined to “Neutral Inflationary Pressures” and sitting just above levels indicating “Low Inflationary Pressures.” (Figure 1)
The model correctly called the build-up of inflationary pressures when it moved above 0% on 11-30-2020, when the CPI was running at a 1.2% annual rate—well before most prognosticators saw inflation as a threat. (The model is supported by 22 indicators evaluating commodity prices, consumer prices, producer prices, and industrial production.)
We think the Fed must be seeing the deceleration in pricing and the improvement in supply chains. Further, they surely are aware that the rate increases already enacted have yet to be fully felt by the markets.
Note the CPI annual rate-of-change during the 1970s period, and how quickly it shifts from one extreme to the other. Also note how quickly inflation abated during past bear markets. It is quite likely we are in a similar period of adjustment.

Figure 1: NDR Inflation Timing Model
The Fed has a policy decision announcement this week and investors are currently pricing in an 86% probability of a 75bps hike and a 14% chance of a 100bps hike (Figure 2). If the Fed goes with 75 bps and states that they will remain data-dependent, we think the market stabilizes. If they go with 100 bps and talk tough, the markets will react negatively. At this point, to reiterate, the Fed is quite aware of the significant global economic slowdown already in place. Further, it is well known that rate hikes take time to work through the financial system. Our view is that the force of the hikes already enacted hasn’t been fully worked into the system and the Fed realizes this as well. We see the prudent course for the Fed as moving to a neutral stance.

Figure 2: CME Group Fed Watch Tool
One of our favorite indicators to keep an eye on is options adjusted spreads (OAS) in the bond markets (Figure 3). This spread is the difference between a group of bonds and their corresponding U.S. government debt security. An example would be the difference between the interest rate on a bond from an investment grade-rated U.S. company with 5 years to maturity versus the interest rate on a 5-year U.S. Treasury note. Typically, OAS spreads will widen when fixed income investors, which tend to be larger sophisticated institutions, become more worried about risks to the economy. They consequently expect a higher interest rate on money lent. While spreads have been slightly rising recently, they are just now approaching their historical averages and are nowhere close to levels seen during the 2007/2008 and 2020 economic dislocations.
We view this positively. With OAS spreads around their historical average, it indicates that a major financial dislocation is less likely to occur.
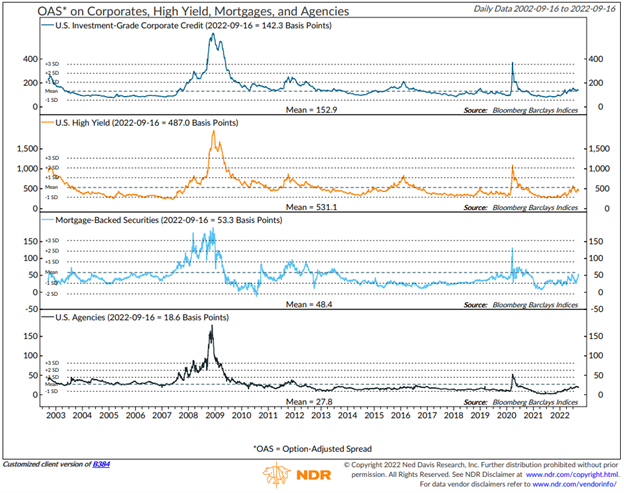
Figure 3: NDR OAS on Corporates, High Yield, Mortgages, and Agency Bonds
VALUATIONS
Given the market pullback this year, the broader markets are now near normal valuation levels versus the historically elevated levels we saw at the end of 2021 (Figure 4). Forward (Expected) Earnings Yields, Earnings (Reported) Yields, and Cash Flow Yields are all above their 5-year averages. When evaluating yields, keep in mind that higher is better. We note that Dividend and Book Value yields are still below their historical averages. However, the world has changed and companies are 1) less inclined to pay dividends and 2) their tangible book values do not include intangible assets, which have become a larger part of a company’s overall value during the age of tech. All in all, the markets are trading nearer to historical measures of fair value, which have often provided longer-term support.

Figure 4: U.S. Index Valuation Metrics
TECHNICALS/SENTIMENT
There has been some technical improvement recently as the majority of global markets now have rising 50-day moving averages (Figure 5). We have also seen our breadth thrust (extreme buying volume) indicators turn bullish in recent weeks. These too, are supportive.

Figure 5: 50-Day Moving Average Indicators
One of our favorite indicators, investor sentiment, remains in the excessive pessimism zone (Figure 6). From a contrary opinion perspective, this has historically been a bullish support. The great investor Warren Buffett famously quipped, “Be fearful when others are greedy. Be greedy when others are fearful.”

Figure 6: NDR Sentiment Index
Overall, the weight of the evidence is leaning towards being neither overly pessimistic nor overly optimistic at this time. While inflation is improving, it is still above historical norms and the Federal Reserve is still in tightening mode. Our view is that this information is already being priced in by investors as valuations have returned to normal levels, and fixed income investors do not appear to be pricing in any kind of large financial dislocation based on OAS spreads. After last week, the market is back to where it was in mid-July and about 6.5% above its June lows. Keep in mind, the market does not care if things are bad or good, only if they are getting better or worse. This is evident in the chart below that shows that, historically, the stock market has tended to bottom about four months before the end of a recession on average.

Figure 7: NDR Market Performance Around Recession End Dates
We are ready to act as our indicators direct. If you have any questions or would like to discuss in more detail, please email or call me directly.
Have a great week,
Regan Teague, CFA®, CFP®
Senior Investment Officer & Financial Advisor
Day Hagan Private Wealth
—Written 09.19.2022.
Print PDF Copy of the Article: Day Hagan Private Wealth Market Update: Market Volatility Remains (pdf)
Disclosure: The data and analysis contained herein are provided “as is” and without warranty of any kind, either express or implied. Day Hagan Private Wealth (DHPW), any of its affiliates or employees, or any third-party data provider, shall not have any liability for any loss sustained by anyone who has relied on the information contained in any Day Hagan Private Wealth literature or marketing materials. All opinions expressed herein are subject to change without notice, and you should always obtain current information and perform due diligence before investing. DHPW accounts that DHPW or its affiliated companies manage, or their respective shareholders, directors, officers and/or employees, may have long or short positions in the securities discussed herein and may purchase or sell such securities without notice. The securities mentioned in this document may not be eligible for sale in some states or countries, nor be suitable for all types of investors; their value and income they produce may fluctuate and/or be adversely affected by exchange rates, interest rates or other factors.
Investment advisory services offered through Donald L. Hagan, LLC, a SEC registered investment advisory firm. Accounts held at Raymond James and Associates, Inc. (member FINRA, SIPC) and Charles Schwab & Co., Inc. (member FINRA, SIPC). Day Hagan Asset Management and Day Hagan Private Wealth are both dbas of Donald L. Hagan, LLC.