MARKET UPDATE OCTOBER 5, 2022
SUMMARY
Both stock and bond markets continued their negative reaction to last week’s Fed meeting on September 20-21. The Fed continues to be forthright with their plans to fight inflation by tightening monetary policy through increasing interest rates and decreasing their bond purchases. Surprisingly for most investors—and of historic importance—the return on longer-term (20+ year) U.S. Treasury bonds remains worse than stocks (year-to-date). We are more defensive in our equity portfolios as our Catastrophic Stop model recently took the Smart Sector strategy to a 50% cash position. We also continue to underweight bonds across our portfolios. In their place, we have been recommending fixed indexed annuities, which are designed to hold their value as stocks and bonds decline. (Note: We view fixed indexed annuities as a bond alternative.) That said, we are beginning to see opportunities in the fixed income space, as we wrote about last week. We also noted the possibility of a short-term relief rally, which the markets are currently experiencing. For us to view the rally as a longer-term opportunity, we’d need to see several factors fall in place, discussed in this letter.
BROAD MARKET PERFORMANCE (AS OF 9/30/2022)
| YTD Performance | Trailing 1 Year Performance | |
|---|---|---|
| SPY (SPDR S&P 500 ETF) | -22.73% | -15.23% |
| DIA (SPDR DJIA ETF) | -18.39% | -13.40% |
| QQQ (Nasdaq 100 ETF) | -31.33% | -23.86% |
| TLT (20+ Year US Treasury ETF) | -26.75% | -26.75% |
| AGG (US Agg Bond ETF) | -14.28% | -14.28% |
| Table 1: Source: ETFdb.com. | ||
MACROECONOMIC VIEW
While the U.S. Federal Reserve Bank continues to tighten monetary policy through interest rate and restrictive balance sheet policies, they are not the only ones. As the chart below shows, the vast majority of central banks across the world are coordinated with the U.S. central bank and are increasing rates as well. Nevertheless, we are seeing some central banks break rank. For example, our British friends across the pond announced last week a plethora of measures aimed at stimulating the U.K. economy. The central bank is pausing their path of rate increases while simultaneously announcing they will be buying back government bonds to put more cash into their financial system. Unfortunately, they are compelled to do this because their financial system is extremely fragile and several U.K. banks and financial companies are in dire straits. We will see if this is the beginning of a trend across other economies. While the shift from restrictive to stimulative was hailed by investors as positive initially, keep in mind that the underlying reason for the Bank of England’s move was the weakness of their economy and financial underpinnings. If other countries follow suit, and for the same reasons, the markets may continue to applaud, only to find that the optimism was premature.

Figure 1: NDR Breadth of Central Bank Rate Changes
VALUATIONS
Over the past few weeks, we have highlighted earnings, cash flow, dividend, and book value yields as useful valuation metrics. This week we would like to highlight NDR’s calculation of the S&P 500’s Price/Earnings Ratio. On a long-term basis (looking back to 1964), the index appears to still be above its median level. If we focus on the past 22 years, the market appears to be trading near its average level. Keep in mind, the Fed fund’s rate back in 1980 topped out at 20%, which caused markets to trade at much lower valuation levels. While the Fed is currently increasing rates, their near-term target rate is about 4.5%, which is supportive of a higher valuation multiple than what the market experienced back in the 1980s and 1990s. Nonetheless, the market as a whole is not yet inexpensive by our work and appears around “Fair Value,” although we continue to watch analysts’ earnings revisions, as those could be a headwind on valuation multiples.

Figure 2: NDR Price-To-Earnings Ratio
TECHNICALS/SENTIMENT
In last Tuesday’s Tech Talk, which you can read here, our own Art Huprich, CMT, wrote, “The domestic equity market has been sold down very hard. As of 9/23/22 almost 70% of S&P 500 components are down 20% or greater from their 252-day high. The same figure (% of stocks down 20% or greater from their 252-day high) for the S&P 400 Mid-Cap Index, NASDAQ, and S&P 600 Small Cap Index is 72%, 76%, and 80% respectively. This hurts! The percentage of NASDAQ stocks down 50% or greater from their 252-day high is 48%, as of 9/23/22. Wow!”
You can see in the Ned Davis Research Big Mo Multi-Cap Tape composite (Figure 3) that the vast majority of the 100 indicators it evaluates are telling us to be cautious at this juncture.
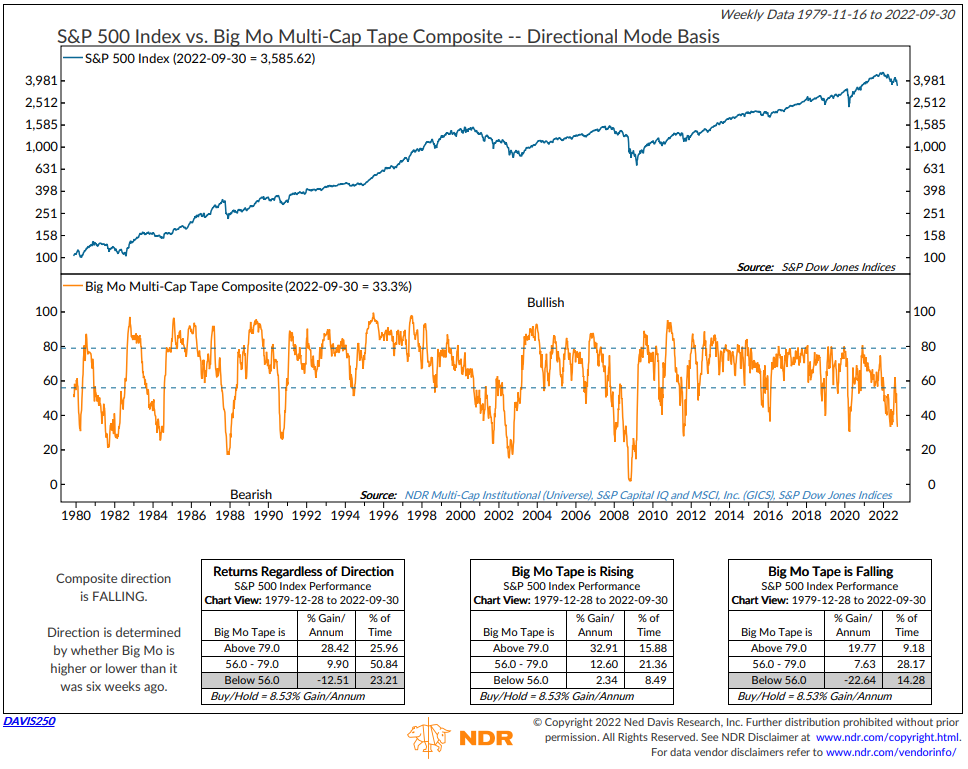
Figure 3: NDR Big Mo Tape Composite
Again, from Art Huprich’s Tech Talk last week, “Sentiment is abysmal—as a contrary indicator this is supportive. Quarter-end positioning, algo or otherwise, is bearish—once a catalyst causes this to reverse, a move higher could be sharp and violent. While the S&P 500 has set a new reaction low on a closing basis, it is retesting (but has not taken out) its mid-June intraday low of 3636. However, this retest is occurring on much less selling pressure than what was recorded in mid-June. All of this screams that the equity market should rally now, this week or early next week once the new quarter begins. If it fails to do so it will be bearish, and I’ll refer you back to the heading above.”
We are seeing the sharp and violent scenario play out so far this week as the S&P 500 is up almost +6% in two days as I write this, but this appears to be a short-term relief rally based on the indicators we are watching.
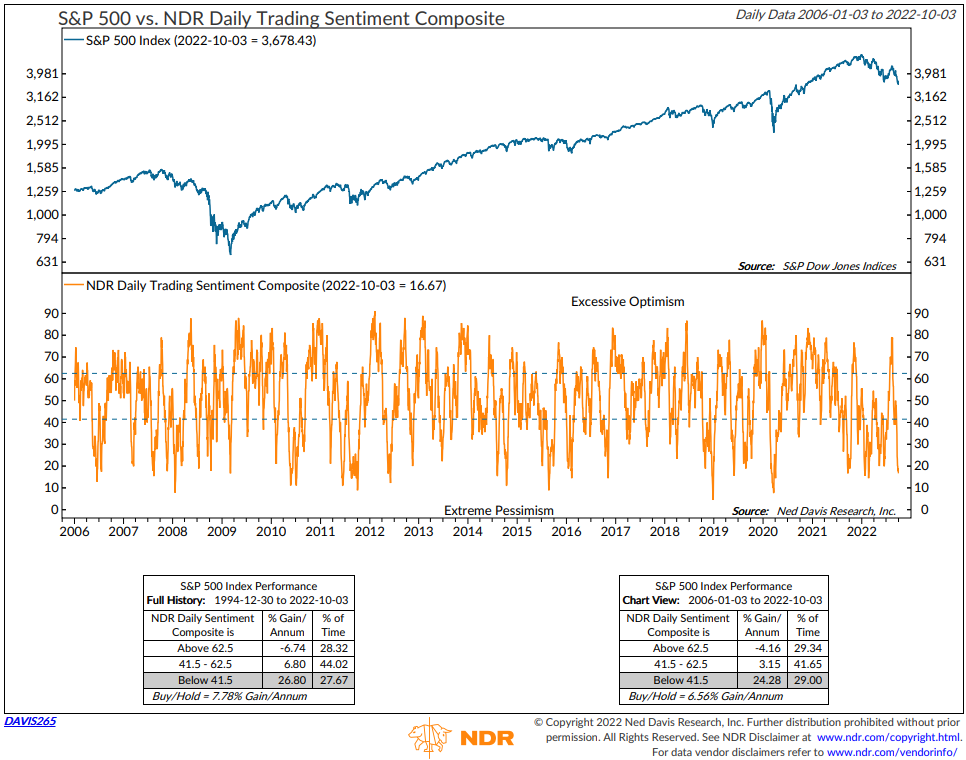
Figure 4: NDR Daily Trading Sentiment Composite
Overall, we continue to follow NDR’s first rule of research: “Don’t fight the Fed.” The negative sentiment and positioning at the end of last quarter created a high likelihood of a short-term bounce, which we are seeing play out so far this week. Risks are still elevated and we are staying cautious across your portfolios given the macroeconomic headwinds that remain. As always, if you have any questions or would like to schedule a portfolio review, don’t hesitate to reach out.
Have a great week,
Regan Teague, CFA®, CFP®
Senior Investment Officer & Financial Advisor
Day Hagan Private Wealth
—Written 10.04.2022.
Print PDF Copy of the Article: Day Hagan Private Wealth Market Update: Market Update October 5, 2022 (pdf)
Disclosure: The data and analysis contained herein are provided “as is” and without warranty of any kind, either express or implied. Day Hagan Private Wealth (DHPW), any of its affiliates or employees, or any third-party data provider, shall not have any liability for any loss sustained by anyone who has relied on the information contained in any Day Hagan Private Wealth literature or marketing materials. All opinions expressed herein are subject to change without notice, and you should always obtain current information and perform due diligence before investing. DHPW accounts that DHPW or its affiliated companies manage, or their respective shareholders, directors, officers and/or employees, may have long or short positions in the securities discussed herein and may purchase or sell such securities without notice. The securities mentioned in this document may not be eligible for sale in some states or countries, nor be suitable for all types of investors; their value and income they produce may fluctuate and/or be adversely affected by exchange rates, interest rates or other factors.
Investment advisory services offered through Donald L. Hagan, LLC, a SEC registered investment advisory firm. Accounts held at Raymond James and Associates, Inc. (member FINRA, SIPC) and Charles Schwab & Co., Inc. (member FINRA, SIPC). Day Hagan Asset Management and Day Hagan Private Wealth are both dbas of Donald L. Hagan, LLC.