MARKET UPDATE OCTOBER 27, 2022
SUMMARY
On October 13, the S&P 500 initially opened down -1.58% after the monthly CPI report came in worse than expected but quickly reversed course and closed up +2.06% on the day. From a technical perspective, investor sentiment had become so bad it was good. Interestingly, the number of put options (an investment that makes money as securities do gown in value) purchased reached record highs. At the same time, large institutions showed a record amount of cash holdings. Together, these factors increased the probability of a bear market rally, which we continue to see play out. For perspective, the Day Hagan Smart Sector strategy turned defensive on September 22, selling half of its equity positions and increasing the cash allocation to 50%. (The strategy used the negative market open on October 13 to redeploy half of the cash raised in September as the short-term models turned positive.)
BROAD MARKET PERFORMANCE (AS OF 10/24/2022)
| YTD Performance | Trailing 1 Year Performance | |
|---|---|---|
| SPY (SPDR S&P 500 ETF) | -19.31% | -15.12% |
| DIA (SPDR DJIA ETF) | -11.96% | -10.00% |
| QQQ (Nasdaq 100 ETF) | -29.66 | -25.10% |
| TLT (20+ Year US Treasury ETF) | -36.64% | -34.62% |
| AGG (US Agg Bond ETF) | -16.60% | -16.25% |
| Table 1: Source: ETFdb.com. | ||
MACROECONOMIC VIEW
As we have been writing about for most of this year, economic data in the U.S. and across the globe continues to weaken. Both the U.S. Services and Manufacturing Purchasing Manager Indexes contracted in October—the fourth consecutive negative reading—and is now near the lower levels seen in June 2020.
While the housing market has held up reasonably well given the first few rate hikes, we are now seeing the effects of mortgage rates doubling from their lows in roughly 12 months’ time. The Case Shiller 20 City home price month-over-month composite has now dropped for two consecutive months. The latest monthly drop of -1.32% was worse than the -0.8% expected and is approaching the level of decreases witnessed in 2008-2009. However, because of the massive run-up in prices over the past year, even with the recent 2-month decline, the index is still up +13.08% year-over-year.
Figure 1: CoreLogic Case Shiller Home Price Composite
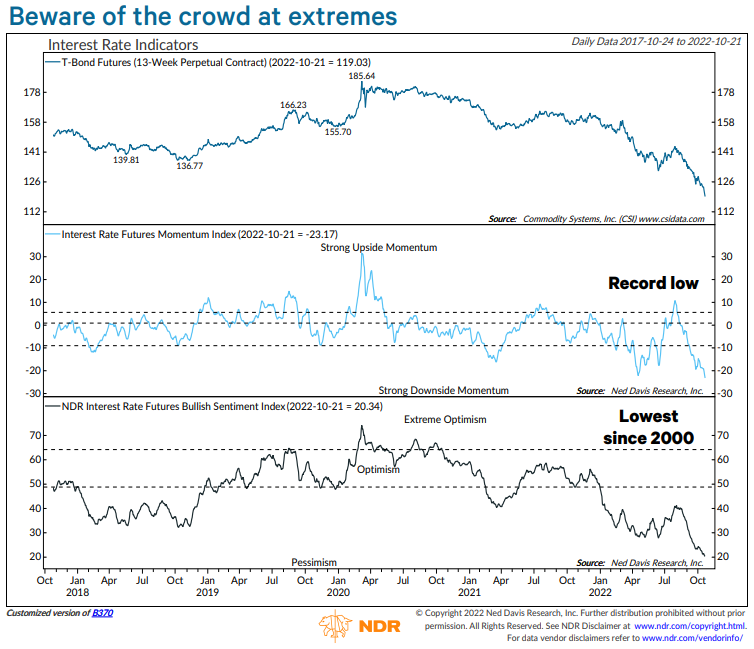
While equity prices have seen a rebound in the near-term, bonds continue to have their worst year on record. New bonds being issued by corporations and municipalities have seen a 36% decrease from their peak in March of 2021, as interest rates drive the cost of borrowing higher. Much like we saw in the equity markets prior to the CPI report, investor sentiment around interest rates and bonds is extremely pessimistic. In fact, NDR’s interest rate sentiment indicator is now at its most pessimistic reading since the years 1994 and 2000. This could provide some support for bonds in the near-term, but we are waiting for the Fed to indicate they are ready to slow their pace of rate hikes before becoming overly bullish in the space.
Figure 2: NDR’s Interest Rate Sentiment Indicators
VALUATIONS
Third quarter earnings season is underway, and of the 20% of companies that have reported, 72% have reported actual earnings-per-shares (EPS) above the average analyst estimates. This is slightly below the one-, five-, and 10-year averages.
We are keeping an eye on earnings estimates and the potential for negative revisions for 2023. Research shows that earnings typically decline by -20% during a recession. Current estimates for next year are still positive. This is a potential disconnect. Currently 247 companies in FactSet’s earnings index have issued EPS guidance for their current fiscal year (either 2022 or 2023). Fifty-one percent of companies are issuing negative guidance, which has caused the Net Earnings Revision Index, which is a three-month average of forward earnings estimates, to decrease for each of the past three months.
Figure 3: S&P 500 Net Earnings Revision Index
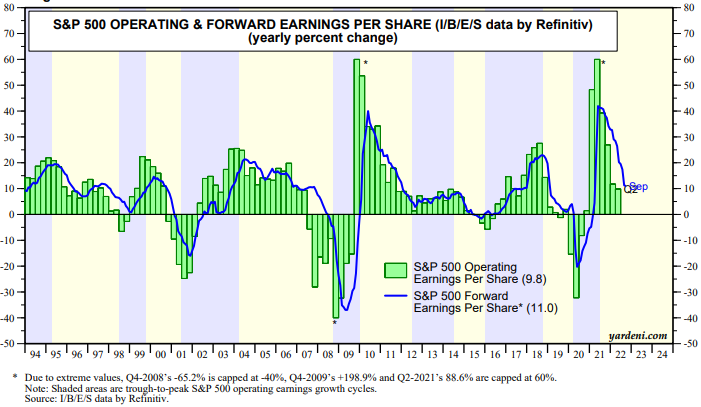
Reported and expected (forward) earnings-per-share continue to decline, but analysts are still projecting 11% growth in earnings over the next 12 months. We think there is still more risk to be priced in given the average -20% decrease in earnings results during recessions.
Figure 4: S&P 500 Operating & Forward Earnings Per Shares
TECHNICALS/SENTIMENT
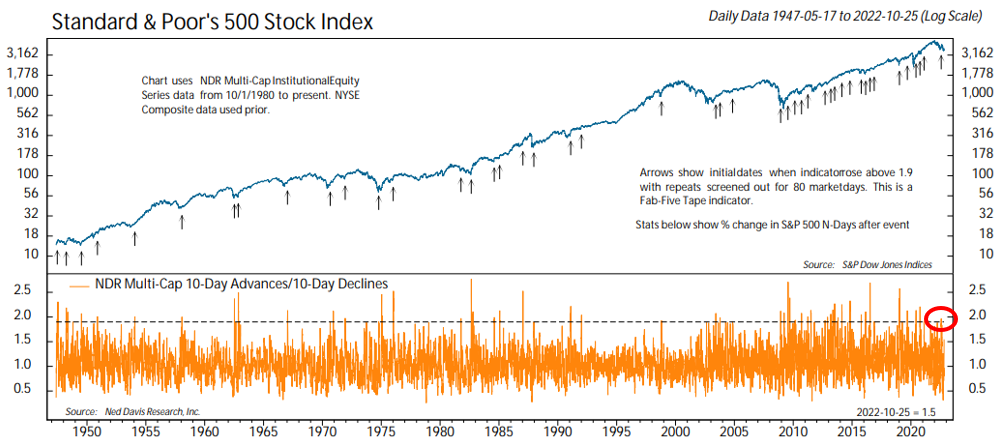
In our last Market Update report, we mentioned that, “While the extreme pessimism sentiment and other technical improvements are positive signs, intermediate-term breadth needs to improve to confirm any sort of sustainable year-end rally.” We have seen signs of intermediate-term breadth improving as one of our favored breadth-thrust indicators turned bullish. Concurrently, the NDR Daily Trading Sentiment Composite has moved higher from levels denoting excessive pessimism. This indicates that investors may be adopting a more risk-on approach into year-end. We’re watching closely, Note: The aforementioned breadth thrust indicator looks at the ratio of stocks advancing to stocks declining over a 10-day period. A 2:1 ratio (twice as many stocks going up as going down) over the 10-day period is a bullish signal that demand is improving.
Figure 5: NDR Multi-Cap 10-Day Advances/10-Day Declines
When the short- and intermediate-term technical and sentiment indicators turned bullish two weeks ago, we increased equity exposure by 25% in the Smart Sector strategy. If our longer-term models also turn bullish, the remaining cash will get reinvested. If they remain risk-off and the internal (technical and sentiment) indicators return to a bearish signal, we will return to a 50% cash allocation within the strategy.
Overall, we continue to remain cautious and follow NDR’s first rule of research: “Don’t fight the Fed.” During the market’s highly negative opening after the CPI report on October 13, we slightly increased our equity exposure given the technical and sentiment model improvement. Investors had become overly pessimistic as indicated by the record amounts of put options (assets that appreciate in value as the underlying security’s price decreases) purchased towards the beginning of the month, retail investors’ high cash balances, survey data, and low dealer positioning. As Warren Buffet says, “Be greedy when others are fearful.” If the aforementioned tailwinds should once again turn into headwinds, and the macroeconomic picture remains challenging, we will be quick to reduce equity exposure.
Have a great week,
Regan Teague, CFA®, CFP®
Senior Investment Officer & Financial Advisor
Day Hagan Private Wealth
—Written 10.25.2022.
Don Hagan, CFA®, Partner
Art Day, Partner
Natalie Brown, CFP®
Print PDF Copy of the Article: Day Hagan Private Wealth Market Update: Market Update October 25, 2022 (pdf)
Disclosure: The data and analysis contained herein are provided “as is” and without warranty of any kind, either express or implied. Day Hagan Private Wealth (DHPW), any of its affiliates or employees, or any third-party data provider, shall not have any liability for any loss sustained by anyone who has relied on the information contained in any Day Hagan Private Wealth literature or marketing materials. All opinions expressed herein are subject to change without notice, and you should always obtain current information and perform due diligence before investing. DHPW accounts that DHPW or its affiliated companies manage, or their respective shareholders, directors, officers and/or employees, may have long or short positions in the securities discussed herein and may purchase or sell such securities without notice. The securities mentioned in this document may not be eligible for sale in some states or countries, nor be suitable for all types of investors; their value and income they produce may fluctuate and/or be adversely affected by exchange rates, interest rates or other factors.
Investment advisory services offered through Donald L. Hagan, LLC, a SEC registered investment advisory firm. Accounts held at Raymond James and Associates, Inc. (member FINRA, SIPC) and Charles Schwab & Co., Inc. (member FINRA, SIPC). Day Hagan Asset Management and Day Hagan Private Wealth are both dbas of Donald L. Hagan, LLC.


