MARKET UPDATE NOVEMBER 15, 2022
SUMMARY
All eyes remain on the Fed as they appear to be nearing a slowdown on the magnitude of rate hikes in the coming months. After the latest CPI print, the market is pricing in a roughly 80% probability of a 50bps hike in December followed by a 50/50 chance of a 50bps or 25bps hike in February. You have seen the effects on the stock market as the S&P 500 gained roughly +10.9% after the CPI report on October 13 through the end of the month. Additionally, the S&P 500 was up +5.5% last Thursday (11/10) after the November CPI report came in slightly lower (better) than expectations. The shift in expectations around Fed policy, extremely pessimistic market sentiment, and new liquidity coming into equities from stock buybacks and institutional orderbook rebalancing could provide some support for the equity markets from now through the end of the year, but eventually the economy will come back to center stage.
BROAD MARKET PERFORMANCE (AS OF 11/11/2022)
| YTD Performance | Trailing 1 Year Performance | |
|---|---|---|
| SPY (SPDR S&P 500 ETF) | -15.13% | -12.77% |
| DIA (SPDR DJIA ETF) | -5.61% | -4.23% |
| QQQ (Nasdaq 100 ETF) | -27.26% | -25.82% |
| TLT (20+ Year US Treasury ETF) | -32.71% | -32.46% |
| AGG (US Agg Bond ETF) | -13.85% | -13.83% |
| Table 1: Source: ETFdb.com. | ||
MACROECONOMIC VIEW
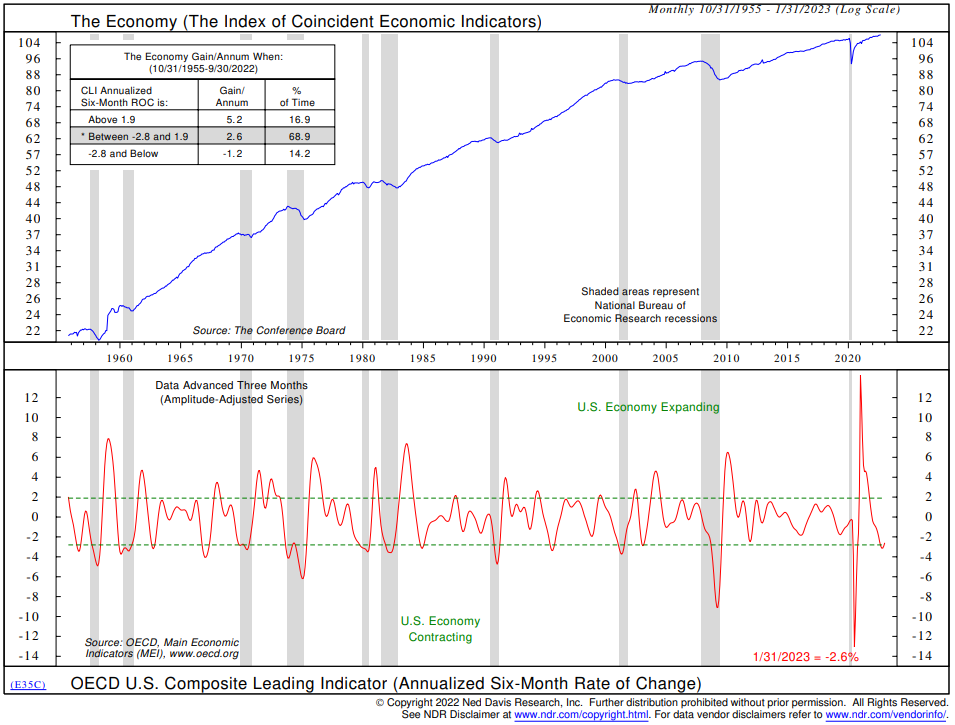
The global economy continues to weaken as PMIs contracted for the third straight month in October. Not all indicators are at levels that suggest a severe recession is imminent, but risks are rising. The OECD U.S. Leading Economic Indicator shows the economy is currently contracting slightly.
Figure 1: OECD U.S. Composite Leading Economic Indicators
One of the areas of the economy hit hardest by the Fed’s dramatic interest rate increase is mortgage demand. This historic rate increase has caused mortgage demand to fall below levels seen during the Great Financial Crisis. In turn, new housing starts have slowed and banks are tightening standards in response to expected weakness going forward. As we wrote about in the last Market Update, we also are seeing the Case-Shiller 20 City Home Price Composite continue to indicate declining existing home values.
Figure 2: Housing Starts Vs Demand and Standards for Residential Mortgages
While many pundits are proclaiming that consumer spending is still holding up reasonably well, it appears that is a result of consumers tapping into their credit cards. Revolving credit balances have grown by +15% year over year, which is a historically high level of growth. Overall, consumer balance sheets are currently not at alarmingly high levels of debt, but they are trending that way.
Figure 3: Consumer Credit Components Year-Over-Year Change
VALUATIONS
As we have been writing about in the last few updates, we continue to watch earnings estimates and companies’ guidance for 2023. Goldman Sachs recently lowered their 2023 earnings growth forecasts to 0% and others are following their lead. We believe there could be more downside revisions as the average decline in earnings during recessions is -20%, according to a study by NDR.
Through November 4, the number of companies that have missed analyst estimates for earnings per share (EPS) is at the highest levels since Q1 of 2015. “Growth” stocks, as defined by traditional Wall Street mantra, are leading the current earnings slowdown. If you have been watching the performance of the NASDAQ index YTD (~-27%), you are fully aware of this. Even companies that have traditionally been defined as “Value” stocks but have transitioned into new business segments that are expected to experience large growth have been punished by the market with earnings misses or forward guidance by management coming in lower than what analysts were expecting. For example, Disney is expected to see robust growth from the streaming segment, but the stock was down about -13% after the earnings announcement.
Figure 4: S&P 500 Companies with Positive Earnings Surprises
At this point in the market cycle, owning high-quality companies that are trading at levels offering a margin of safety is of utmost importance. While “Value” is outperforming “Growth” this year, we don’t believe that the traditional Wall Street definitions are good enough. Disney is a perfect example of a Value stock that was down -13% after earnings and is down close to -40% year-to-date. The Day Hagan Smart Value strategy doesn’t focus on companies that fit into any kind of style box, but focuses instead on highly profitable companies trading at very attractive valuations based on the cash flow they are generating for shareholders. This has proved to be prudent this year, as the strategy is basically flat on the year (Total Return) versus the S&P 500 being down roughly -15%.
TECHNICALS/SENTIMENT
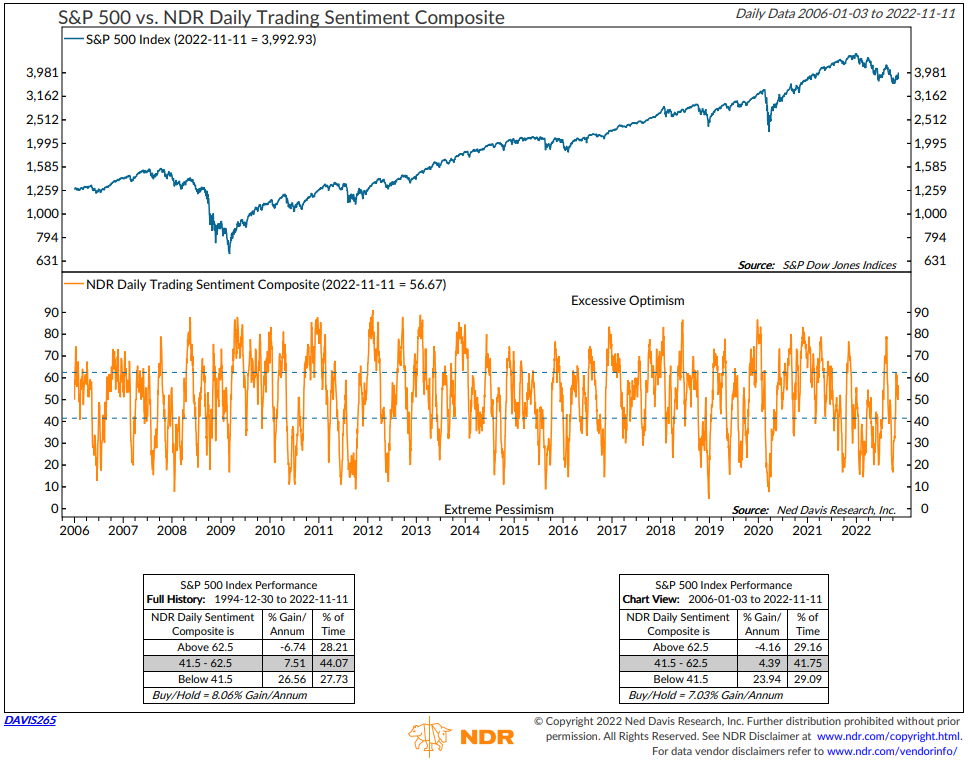
The S&P 500 is up roughly +13% from when our short-term overbought/oversold (OBOS) models reached bullish levels at the October lows and we began reallocating cash in the Smart Sector strategy. We are now one hundred percent invested after the November 1 rebalance. Even with the large move up in the market over the past 3 weeks, the Daily Trading Sentiment model has not reached “Excessive Optimism” levels and remains in the neutral zone, which is constructive for the market.
Figure 5: NDR Daily Trading Sentiment
Other bullish technical factors we are keeping an eye on as we move through the end of the year are short covering, institutional option buying, and order book management and share buybacks. Although it feels like an eternity ago, the Inflation Reduction Act passed this year by Democrats, essentially down party lines, initiates a 1% tax on corporate share buybacks starting next year. This, in addition to the large decreases in share prices across most companies, has led to one of the largest announced share buyback authorizations we have ever seen. It amounts to roughly $10 billion per day in purchases by corporations.
Figure 6: US Share Buyback Authorization Announcements
Overall, the economy continues to show signs of weakening with earnings estimates coming down. The housing market appears to face more downside until prices adjust to the record-fast and drastic increase in mortgages rates. We believe this will come into focus early next year, but currently the Fed’s assumed slowdown in rate increases and liquidity coming into equities through share repurchases and dealer positioning are constructive for the markets to experience a near-term rally. As always, we continue to monitor the models and will be quick to act should these short- to intermediate-term bullish factors begin to dissipate.
Have a great week,
Regan Teague, CFA®, CFP®
Senior Investment Officer & Financial Advisor
Day Hagan Private Wealth
—Written 11.14.2022.
Don Hagan, CFA®, Partner
Art Day, Partner
Natalie Brown, CFP®
Print PDF Copy of the Article: Day Hagan Private Wealth Market Update: Market Update November 16, 2022 (pdf)
Disclosure: The data and analysis contained herein are provided “as is” and without warranty of any kind, either express or implied. Day Hagan Private Wealth (DHPW), any of its affiliates or employees, or any third-party data provider, shall not have any liability for any loss sustained by anyone who has relied on the information contained in any Day Hagan Private Wealth literature or marketing materials. All opinions expressed herein are subject to change without notice, and you should always obtain current information and perform due diligence before investing. DHPW accounts that DHPW or its affiliated companies manage, or their respective shareholders, directors, officers and/or employees, may have long or short positions in the securities discussed herein and may purchase or sell such securities without notice. The securities mentioned in this document may not be eligible for sale in some states or countries, nor be suitable for all types of investors; their value and income they produce may fluctuate and/or be adversely affected by exchange rates, interest rates or other factors.
Investment advisory services offered through Donald L. Hagan, LLC, a SEC registered investment advisory firm. Accounts held at Raymond James and Associates, Inc. (member FINRA, SIPC) and Charles Schwab & Co., Inc. (member FINRA, SIPC). Day Hagan Asset Management and Day Hagan Private Wealth are both dbas of Donald L. Hagan, LLC.


