MARKET UPDATE MARCH 28, 2023
SUMMARY
The Fed raised rates by another 25 bps in their policy announcement last week, which the market mostly took in stride as the increase was expected. Interestingly enough, the market has been essentially flat since the news broke of the Silicon Valley Bank troubles and was positive last week, even with the Fed’s announcement and Treasury Secretary Yellen’s comments on backing all bank deposits with the FDIC program. While one of the largest and fastest rate increases in history has caused volatility in the stock and bond markets over the past eighteen months, we now appear to be near the end of the hiking cycle, which should ease some investor concerns. That being said, banks’ balance sheets have now been brought to the forefront of investors’ minds over the past few weeks. While we do not believe there to be systemic issues that would cause another financial crisis, we are prepared for some near-term volatility as the risks and uncertainty are assessed by investors. It is in volatile times like this that we must keep in mind Warren Buffett’s famous advice, “Be greedy when others are fearful.”
BROAD MARKET PERFORMANCE (AS OF 3/24/2023)
| YTD Performance | Trailing 1-Year Performance | |
|---|---|---|
| SPY (SPDR S&P 500 ETF) | 3.88% | -10.66% |
| DIA (SPDR DJIA ETF) | -2.22% | -5.25% |
| QQQ (Nasdaq 100 ETF) | 16.93% | -12.89% |
| TLT (20+ Year US Treasury ETF) | 7.86% | -15.98% |
| AGG (US Agg Bond ETF) | 3.77% | -4.01% |
| Table 1: Source: ETFdb.com. | ||
MACROECONOMIC VIEW
The collapse of Silicon Valley Bank (SVB) has reminded investors of the Financial Crisis of 2007-2009. While our view is that the Financial Crisis was more catastrophic and wide-ranging, this time around the regional bank industry has been hit especially hard, evidenced by the KRE (SPDR S&P Regional Bank ETF) being down roughly -32% from its highs of this year. Rising rates across the entire yield curve have put pressure on banks’ balance sheets and are causing depositors to flee to higher-yielding accounts. Unlike 2008 when banks were buying packages of bad mortgages that eventually defaulted as homeowners stopped paying, banks today have much higher-quality balance sheets, as they have large holdings in US Treasury and other government-backed bonds. The problem they have run into is that, due to the Fed’s historic rate hiking cycle, even very secure government bonds have gone down in value as rates increased. For example, the iShares 7- to 10-year treasury bond ETF (Ticker: IEF) is down -13.82% over the past three years through Friday, March 24. This is unprecedented.
To understand what happened to SVB, it’s important to have a basic understanding of how a bank operates. Checking and savings deposits are one way for a bank to raise money. These are liabilities of the bank, and they pay the depositors a stated interest rate. The bank will then use the cash they raise to make or purchase loans (bonds) from other institutions. These are considered the bank’s assets. The banking regulators have very specific standards on what ratio of different types of loans they can make. For example, banks are required to hold a certain percentage of deposits in government-backed bonds.
The problem is that these requirements incentivize the banks to purchase longer-dated, fixed-rate government-backed bonds. And it is precisely these types of securities that lose the most value as interest rates increase. So, in the case of SVB, it is our opinion that the bank didn’t necessarily take on too much risk on the asset side of their balance sheet, but they were too concentrated on the liabilities side with such a homogenous depositor base. This is primarily why the bank run happened. Their depositors, who were in similar situations, demanded lots of cash in a short period of time. The bank was then forced to sell their government-backed bonds prior to maturity at a steep discount due to the Fed’s interest rate increases.
The Fed is attempting to solve this problem, albeit after SVB already went bankrupt, by allowing banks that need cash for large amounts of depositor withdrawals to loan the Fed those banks’ bonds (which are currently at a loss) at par (100 cents on the dollar) for up to one year. In other words, the banks don’t have to take the loss right now. It is delayed for a year, in the hope that by then the mess will have been sorted out. This new Fed program is called the Bank Term Funding Program (BTFP). For example, a bank owns a government Treasury bond that will mature in 2 years at $100 but is currently trading on the open market for $90. Instead of selling that bond to raise cash for depositor withdrawals at $90 (a -10% loss), they can exchange it with the Fed for $100 today. This is a loan by the Fed to the bank, with the 2-year Treasury acting as collateral. The bank will have to pay interest on the $100 loan over the course of the year. So, while the liquidity issue is solved, at least for the next 365 days, there is a cost to the bank that may hinder earnings in the coming quarters.
While the Fed and banking regulators appear to have alleviated the potential near-term problems, they still shoulder quite a bit of blame for the SVB failure. Their regulations incentivized banks to purchase longer-dated, fixed-rate bonds. These types of bonds are more sensitive and decrease in value as rates increase versus shorter-term or floating-rate bonds.
This all happened as the Fed was also increasing interest rates in some of the largest amounts and at one of the quickest paces in history. Due to the “held to maturity” versus “available for sale” accounting rules banks have for valuing assets on their balance sheet, this problem came to light as cash was needed to satisfy withdrawals.
We recognize these regulatory and accounting rule issues, but due to most of the banking industry having a much more diversified depositor base than SVB and the Fed’s new BTFP, we do not currently see sufficient evidence that this is a systematic issue as we saw during the Great Financial (Mortgage) Crisis of 2007-2009. We are also of the opinion that these risks, and a possible hit to earnings in the coming quarters, are less of an issue for larger banks like JP Morgan and Charles Schwab, which we own in our Smart Value strategy. They have more diversified sources of revenue, depositors, and balance sheets as a whole than their smaller regional bank counterparts.
Credit spreads are one of our favorite indicators to watch for stress in the banking sector and the economy as a whole. A credit spread is the difference between the interest rate on a non-government bond—like an investment-grade corporate bond (think Pepsi and Proctor & Gamble)—and a U.S. government bond with a similar time until maturity (for example, both have two years until maturity). When the economy is stable and banks are willing to lend money, the spread between the corporate bond’s interest rate and the government bond’s interest rate will be narrower. On the other hand, when there is stress in the economy, banks become less willing to lend money to non-government agencies, so the interest rate on those bonds must increase to incentivize investors to purchase them. In the last few weeks, credit spreads began to widen, showing signs of stress in the lending markets due to the uncertainty caused by the bankruptcy of a few specialized regional banks. Even so, they remain around historically average levels and below what we saw during the October stock market lows.

Figure 1: NDR OAS (option-adjusted spreads) on Corporates, High Yield, Mortgages, and Agencies
While most investors have been focused on the banking sector, many have missed the continued improvement in other areas of the market. The latest PMIs (measures of economic activity) showed that private sector activity has actually been strengthening. The Global Flash U.S. Composite PMI increased for the second consecutive month and is now in expansion territory (>50) and is at levels not seen since last May.
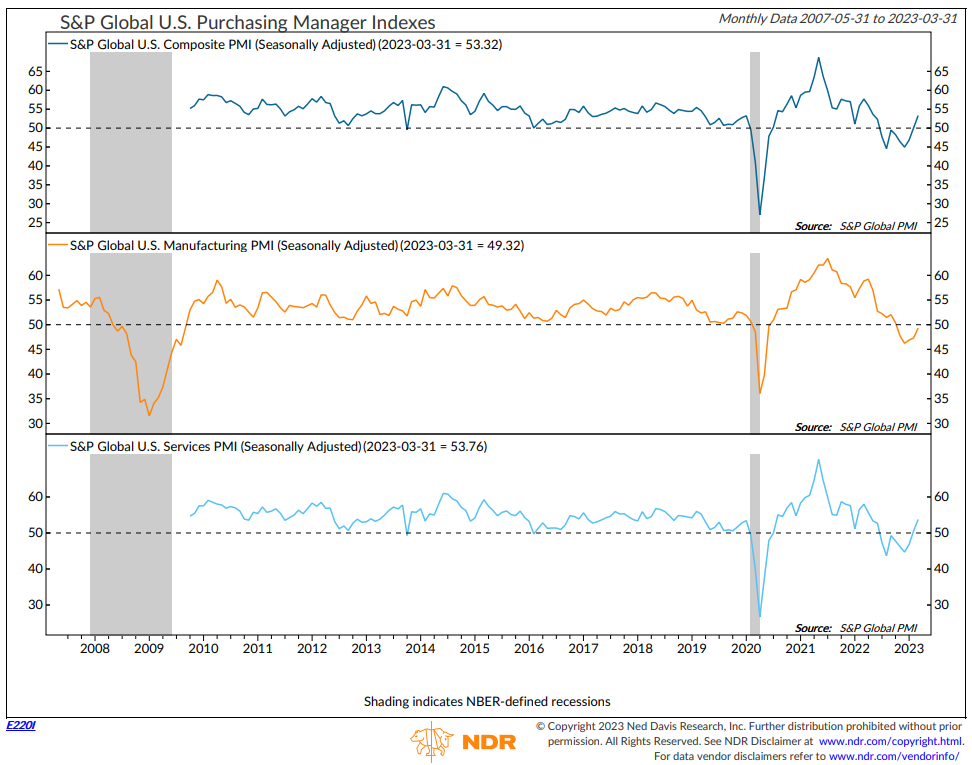
Figure 2: S&P Global U.S. Purchasing Manager Indexes
VALUATIONS
The S&P 500 (large-cap stocks) remains near levels that have historically indicated “fair value” based on forward earnings estimates. Valuations within mid-cap and small-cap stocks are at the lower end of the historical range. Those companies, on average, are trading at multiples that coincide with bear market bottoms last seen in the great Financial Crisis. To us, this means there are still opportunities to buy quality companies at attractive valuations.
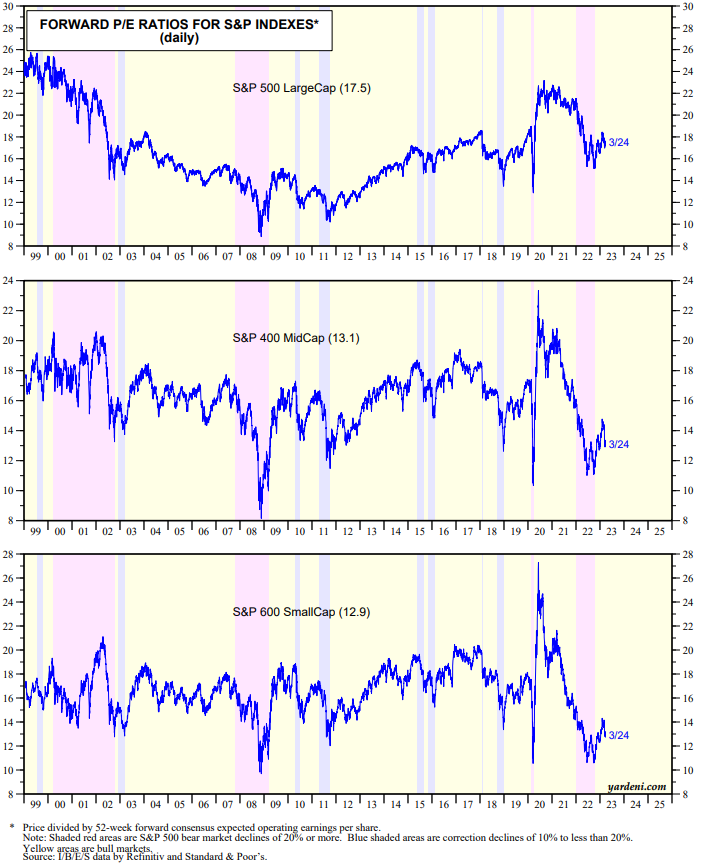
Figure 3: Forward P/E Ratios for S&P 500 Indexes
TECHNICALS/SENTIMENT
The market (S&P 500) is up roughly 4.8% from the lows we saw after the SVB news. This has caused sentiment to tick back up very slightly from Excessive Pessimism into the Neutral Zone. The model has historically been in the Neutral Zone 44.07% of the time since 1994, and during those times the S&P 500 has had an average annual return of 7.23%. For these types of indicators, we go with the flow until it reaches an extreme and reverses. This means that there is room overhead before Excessive Optimism levels are reached and a bearish reading is registered.

Figure 4: NDR Daily Trading Sentiment Composite
Overall, the U.S. economy appears to be firming up despite the daily volatility and investors’ concerns about the current state of the banking sector. The Fed’s new BTFB loan facility should help with most other liquidity issues arising within the banking space and guardrail them from becoming systemic issues in the near term. However, the increased costs could be a headwind for regional banks’ earnings in the coming quarters. The recent issues are the result of the Fed’s interest rate policy, banking regulations that incentivized long-duration securities to be held on banks’ balance sheets, and a very homogenous depositor base within a few of the most-affected regional banks. Credit spreads have widened slightly, but the overall message of the markets is to remain in stocks and focus on high-quality companies generating free cash flow. Should our models indicate that the bank contagion is widening and/or other exogenous negative factors are coming into play, we will be swift in taking risk off the table.
In the meantime, please don’t hesitate to reach out if you have any questions.
Have a great week,
Regan Teague, CFA®, CFP®
Senior Investment Officer & Financial Advisor
Day Hagan Private Wealth
—Written 3.27.2023
Don Hagan, CFA®, Partner
Art Day, Partner
Natalie Brown, CFP®
Print PDF Copy of the Article: Day Hagan Private Wealth Market Update: Market Update March 28, 2023 (pdf)
Disclosure: The data and analysis contained herein are provided “as is” and without warranty of any kind, either express or implied. Day Hagan Private Wealth (DHPW), any of its affiliates or employees, or any third-party data provider, shall not have any liability for any loss sustained by anyone who has relied on the information contained in any Day Hagan Private Wealth literature or marketing materials. All opinions expressed herein are subject to change without notice, and you should always obtain current information and perform due diligence before investing. DHPW accounts that DHPW or its affiliated companies manage, or their respective shareholders, directors, officers and/or employees, may have long or short positions in the securities discussed herein and may purchase or sell such securities without notice. The securities mentioned in this document may not be eligible for sale in some states or countries, nor be suitable for all types of investors; their value and income they produce may fluctuate and/or be adversely affected by exchange rates, interest rates or other factors.
Investment advisory services offered through Donald L. Hagan, LLC, a SEC registered investment advisory firm. Accounts held at Raymond James and Associates, Inc. (member FINRA, SIPC) and Charles Schwab & Co., Inc. (member FINRA, SIPC). Day Hagan Asset Management and Day Hagan Private Wealth are both dbas of Donald L. Hagan, LLC.