MARKET UPDATE JANUARY 18, 2023
SUMMARY
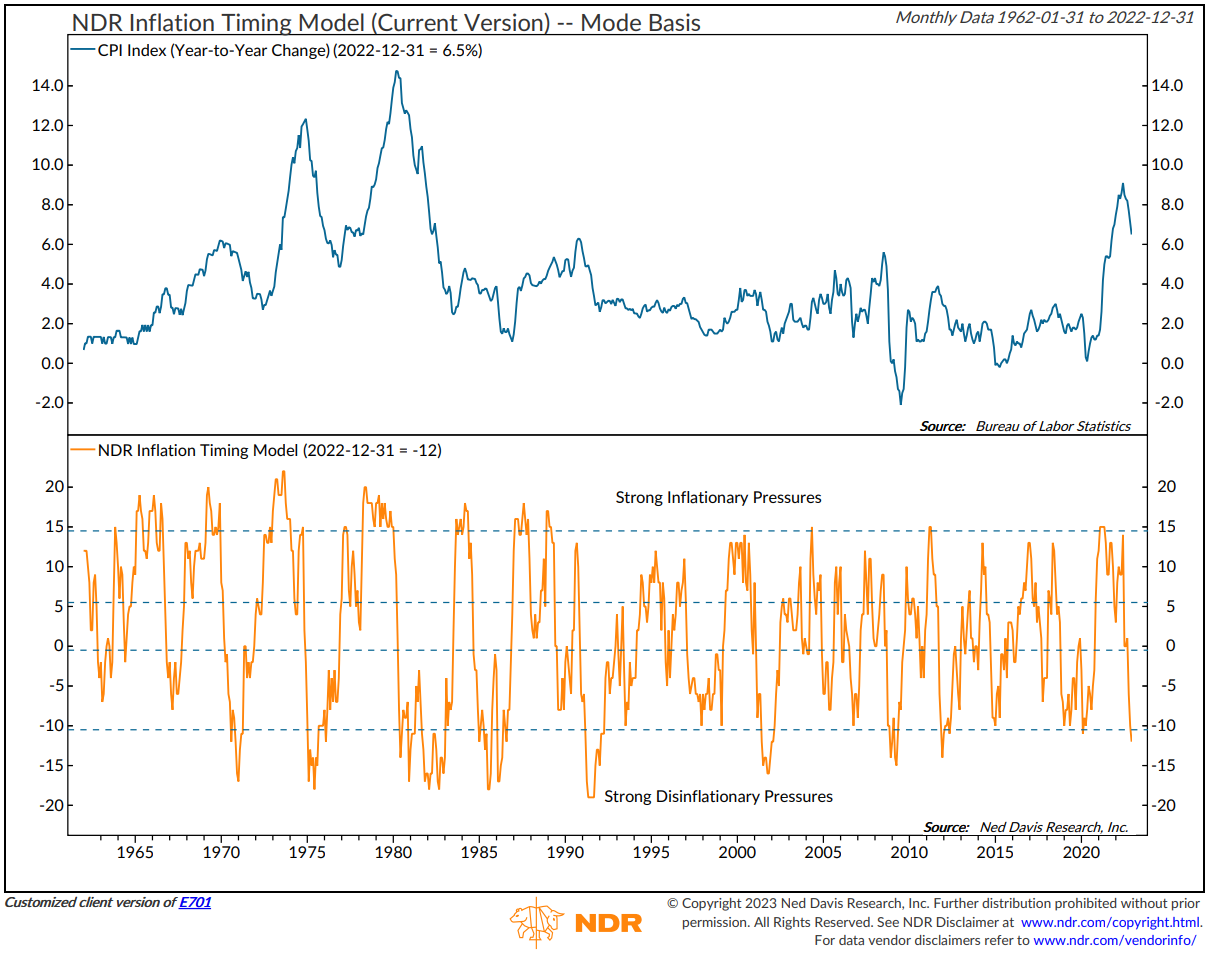
After one of the worst years on record for both equity and fixed-income markets, 2023 is off to a good start with most equity and fixed-income indexes positive for the year so far. Year to date, it has primarily been “risk-on”, with the Nasdaq (QQQ ETF) leading the broad equity markets and longer-maturity treasuries leading the broad fixed-income markets. As we have been discussing since September 2022, inflation continues to move lower, with the likely peak being in August of last year. The Fed’s reaction to this data had been at the forefront of investors’ minds for most of the last year, but with rate hikes expected to end after March, economic expectations could become the new market driver.
BROAD MARKET PERFORMANCE (AS OF 1/17/2023)
| YTD Performance | Trailing 1-Year Performance | |
|---|---|---|
| SPY (SPDR S&P 500 ETF) | 4.01% | -13.02% |
| DIA (SPDR DJIA ETF) | 2.36% | -3.71% |
| QQQ (Nasdaq 100 ETF) | 5.73% | -25.37% |
| TLT (20+ Year US Treasury ETF) | 6.53% | -23.61% |
| AGG (US Agg Bond ETF) | 2.84% | -9.03% |
| Table 1: Source: ETFdb.com. | ||
MACROECONOMIC VIEW
The Fed’s rate hikes overshadowed the financial market narrative for most of last year. They instituted the most aggressive rate-hike trajectory in history to tackle the historic levels of inflation. Current market expectations are that the Fed will hike another 25bps in both February and March, then pause and watch the effects of their policy decisions.
Figure 1: NDR Inflation Timing Model
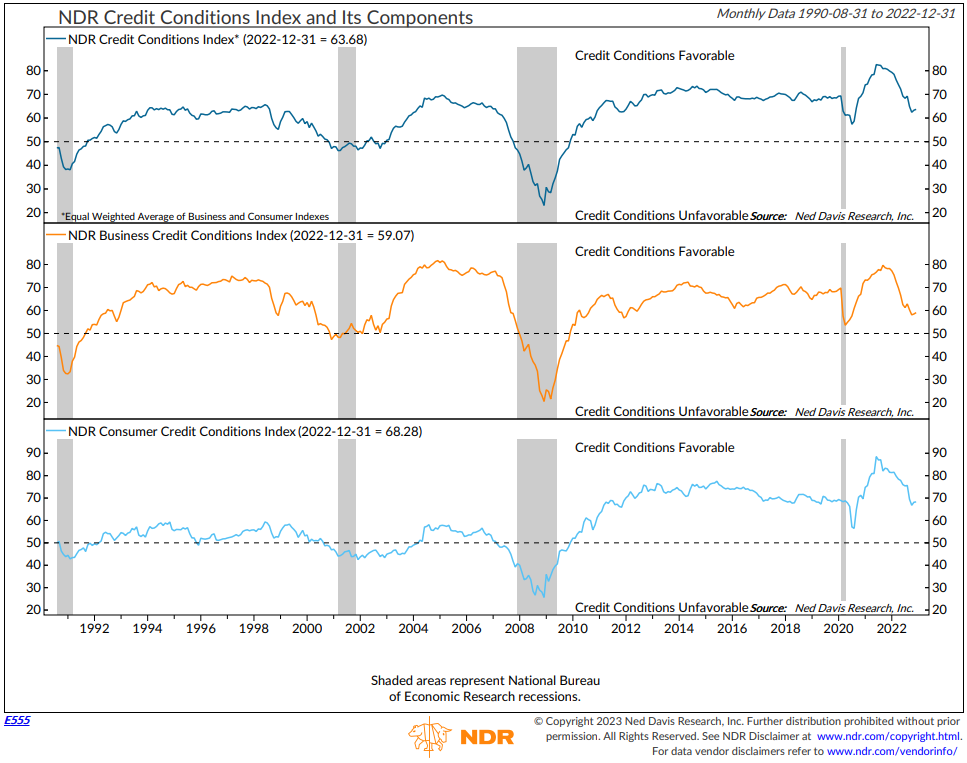
With the Fed’s tightening policy nearing its end, economic data may come back into focus. Most pundits are calling for a mild recession in 2023, which we believe the markets began pricing in last year as they tend to bottom four months before recession on average. This scenario could be bullish for the markets if it does in fact play out. While mild recession is the base case, there are risks that could cause the recession to turn into something worse. We continue to monitor energy policy and prices, unexpected Fed policy decisions, and credit markets as they could present new downside risks.
Figure 2: NDR Credit Conditions Index
Also of note is the housing market. Housing has seen a national slowdown, with mortgage rates nearly doubling over the past 18 months. Even so, 2022 saw a record number of new housing starts relative to the last 10 years, as builders try to keep up with demand. Buyers who signed contracts to build new houses are starting to walk away as the increase in mortgage rates has made the houses unaffordable. KB Homes, the sixth-largest builder in America, just reported that 68% of current contracts were cancelled in the fourth quarter of last year. While the leverage in today’s market is not nearly what it was during the 2006-2008 housing bubble, this is another risk to the mild recession narrative we are watching.
Figure 3: KB Homes Homebuyer Cancellation Rate
VALUATIONS
Even after the pullback that broad equity markets experienced last year, the S&P 500 (large-cap stocks) is trading at historically fair value based on forward earnings estimates. Valuations within mid-cap and small-cap stocks are much more compressed. Those companies, on average, are trading at multiples that coincide with bear market bottoms last seen in the great financial crisis of 2008-2009. To us, this means there is opportunity to buy quality companies at attractive valuations. Interestingly enough, our Smart Value strategy, which invests in individual stocks based on our proprietary valuation methodology, is currently slightly positive since January 1 of last year.
Figure 4: Forward P/E Ratios for S&P 500 Indexes
TECHNICALS/SENTIMENT
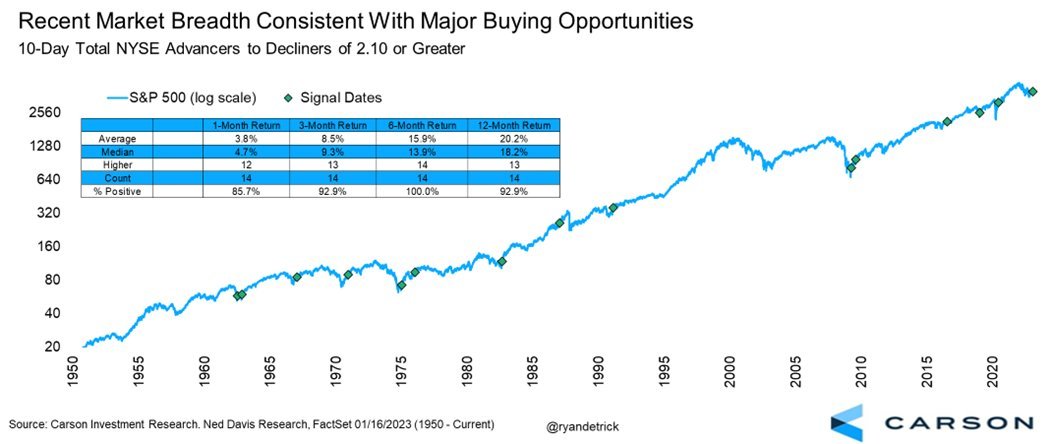
In our Market Update report from October 25 we wrote, “Concurrently, the NDR Daily Trading Sentiment Composite has moved higher from levels denoting excessive pessimism. Additionally, we’ve seen several “breadth thrusts.” This indicates that investors may be adopting a more risk-on approach into year-end. We’re watching closely. Note: The aforementioned breadth thrust indicator looks at the ratio of stocks advancing to stocks declining over a 10-day period. A 2:1 ratio (twice as many stocks going up as going down) over the 10-day period is a bullish signal that demand is improving.” Over the subsequent six weeks, the S&P 500 moved almost +8% higher.
After the market bounce from the October lows, there was some weakness as it pulled back a little over -6% into the end of the year from the December 13 daily highs. That pullback has created another instance of the NDR Daily Trading Sentiment indicator reach extreme pessimism readings along with multiple new breadth thrust buy signals. One such signal is the NYSE 10-day Advance to Decliners 2:1 ratio. Based on a study from our friends at Carson Investment Research, the S&P 500 is positive 92.9% of the time three months later with an average return of +8.5% after such signals.
Figure 5: 10-Day Total NYSE Advancers to Decliners of 2:1 or Greater
We have finally turned the page on one of the worst years in history for both equity and fixed income markets. The Fed’s rate hike policy appears to be nearing an end as inflation continues to decline. We are monitoring the implications of that policy as it ripples through the slowing economy. In our estimation, the market is currently pricing in a base case for a mild recession this year. Risks we continue to monitor that could derail that base case are energy costs soaring from escalations in geopolitical tensions, unexpected negative monetary policy surprises, and credit and housing market unrest. All those risks appear to be muted for now, but we will continue to watch our indicators for stress and take the appropriate course of action. So far this year, investors appear have been risk on but in the near-term sentiment appears to be slightly too optimistic as we head into January options expiration and a plethora of housing data this Thursday and Friday. For now, based on the current state of our indicators and models, we view any upcoming weakness in the markets to present a potential buying opportunity for cash you may have sitting on the sidelines designated for equities.
Lastly, we highly recommend you use the start of a new year as an opportunity to go through the financial planning process with our resident financial planner Natalie Brown, CFP®, who will be reaching out in the coming weeks to schedule a portfolio and financial plan review with you. In our experience, clients with a sound financial plan are less inclined to make emotional—and potentially harmful—decisions in moments of uncertainty.
Have a great week,
Regan Teague, CFA®, CFP®
Senior Investment Officer & Financial Advisor
Day Hagan Private Wealth
—Written 1.18.2023.
Don Hagan, CFA®, Partner
Art Day, Partner
Natalie Brown, CFP®
Print PDF Copy of the Article: Day Hagan Private Wealth Market Update: Market Update January 18, 2023 (pdf)
Disclosure: The data and analysis contained herein are provided “as is” and without warranty of any kind, either express or implied. Day Hagan Private Wealth (DHPW), any of its affiliates or employees, or any third-party data provider, shall not have any liability for any loss sustained by anyone who has relied on the information contained in any Day Hagan Private Wealth literature or marketing materials. All opinions expressed herein are subject to change without notice, and you should always obtain current information and perform due diligence before investing. DHPW accounts that DHPW or its affiliated companies manage, or their respective shareholders, directors, officers and/or employees, may have long or short positions in the securities discussed herein and may purchase or sell such securities without notice. The securities mentioned in this document may not be eligible for sale in some states or countries, nor be suitable for all types of investors; their value and income they produce may fluctuate and/or be adversely affected by exchange rates, interest rates or other factors.
Investment advisory services offered through Donald L. Hagan, LLC, a SEC registered investment advisory firm. Accounts held at Raymond James and Associates, Inc. (member FINRA, SIPC) and Charles Schwab & Co., Inc. (member FINRA, SIPC). Day Hagan Asset Management and Day Hagan Private Wealth are both dbas of Donald L. Hagan, LLC.


